by Daniel V. Schroeder, Department of Physics, Weber State University
This document gives software-specific information on solving problems in the book that require the use of a computer.
Several problems in the book (mostly in chapters 2 and 3) ask you to make tables of multiplicities and related quantities for systems of up to a few hundred particles. These tables, and the graphs that go with them, are most conveniently made in a computer spreadsheet program. However, most spreadsheet programs will overflow on several of the exercises in the book if you try to compute the multiplicities in terms of factorials. Instead, you need to use the built-in function to compute “combinations” (defined on page 51).
In most of the spreadsheet programs currently in use, the name of the combination function is COMBIN. For example, to compute the number of combinations of 20 objects chosen from 100, or “100 choose 20”, you would type “=COMBIN(100,20)”. To compute the multiplicity of an Einstein solid with 100 oscillators and 50 units of energy, you would type “=COMBIN(50+100-1,50)”. The COMBIN function works the same way in Excel, OpenOffice, Numbers, and Google Docs, except that in OpenOffice you need to use a semicolon, instead of a comma, to separate its two arguments.
One crucial trick in most of the spreadsheet problems is to use dollar signs ($) for absolute references. For example, if you have the value of N in cell B2 and the value of q in cell A5, then to compute “q+N-1 choose q” in cell B5 you might use the formula “=COMBIN(A5+B$2-1,A5)”. When this formula is copied down to row 6, the reference to A5 will be automatically changed to A6, where you’ve presumably put the next value of q. But the dollar sign in front of the 2 means that the reference to cell B2 will not be changed to B3, and again, that’s probably what you want.
For more discussion and examples of these kinds of spreadsheet exercises, see the article “A different approach to introducing statistical mechanics” by Thomas A. Moore and myself in the January 1997 issue of the American Journal of Physics (volume 65, pages 26-36). The article also describes how most exercises of this type can be done (though more awkwardly) on a graphing calculator.
You can plot a formula using a spreadsheet, by generating the data to plot in two columns and then creating a graph of these columns. This gets the job done, but it is tedious and doesn't produce the prettiest output. Graphing calculators are very convenient for plotting formulas, but usually are not connected to printers. I therefore recommend learning a more sophisticated software package such as MathCad, Maple, or Mathematica.
In Mathematica, the basic plotting function is Plot[], and the syntax is:
Plot[Exp[-x^2],{x,-3,3}]This instruction generates a plot of the Gaussian function e-x2 for values of x ranging from -3 to 3. Note that all Mathematica functions are case-sensitive, and that built-in functions such as Plot and Exp always start with capital letters. There are an enormous number of variations on the basic Plot function, which you can learn from the online documentation.
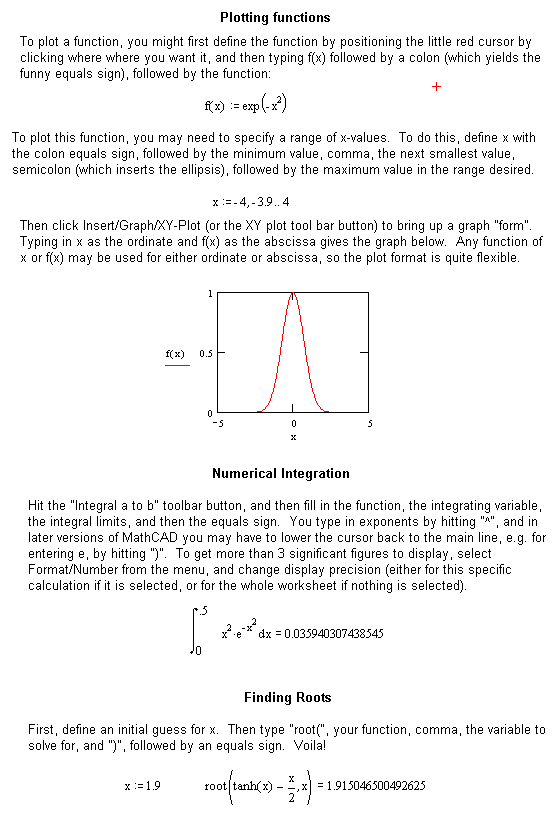
For a brief introduction to plotting in MathCad (written by Phil Fraundorf), click here.
Many professional scientists are now using Python and matplotlib (a.k.a. pylab) to create graphs. While this environment requires some comfort level with coding, it is very powerful and the software is free. Here’s a simple program that plots a Gaussian:
For an annotated version of this program that includes a number of further options, click here.import numpy, pylab x = numpy.linspace(-3, 3, 500) y = numpy.exp(-x**2) pylab.plot(x, y) pylab.show()
Before performing a numerical calculation it’s usually a good idea to plot the relevant function(s) and estimate the answer graphically. Otherwise it’s much too easy to get a wrong answer and not realize it.
Most high-end scientific calculators can do numerical integrals and root finding; just be sure to write down exactly what you punched into the calculator, in case you need to check for errors later.
In a pinch, you can use a spreadsheet to do numerical integrals and root finding. Make a table of the function values and, for the former, add up the area under the graph; for the latter, find the root by trial and error.
Numerical calculations in Mathematica are easy. The numerical integration function is NIntegrate; here is an example:
NIntegrate[x^2*Exp[-x^2],{x,0,.5}]The syntax is exactly the same as for the Plot function, with the list in curly braces specifying the integration variable and the beginning and ending values. To solve a transcendental equation, use the FindRoot function:
FindRoot[Tanh[x]==x/2,{x,1.5}]Note the double = sign in the equation to solve. The number 1.5 tells Mathematica where to start looking for a solution (since there may be more than one); in this case the function returned 1.91501.
For a brief introduction to numerical calculations in MathCad (written by Phil Fraundorf), click here.
These kinds of calculations are also pretty straightforward using the SciPy library for Python. The basic numerical integration function is scipy.integrate.quad, while the basic root-finding function is scipy.optimize.brentq. Both require that you define a function to work with and then pass it using the “lambda” mechanism. Here's a short program that calculates the same results as the Mathematica code above:
import math, scipy.integrate, scipy.optimize
def integrand(x):
    return (x**2) * math.exp(-x**2)
(result, error) = scipy.integrate.quad(lambda x: integrand(x), 0, 0.5)
print 'The integral is', result, '+/-', error
def functionwithroot(x):
    return math.tanh(x) - x/2
result = scipy.optimize.brentq(lambda x: functionwithroot(x), 1, 2)
print 'The root is at x =', result
Section 8.2 of the book gives a “pseudocode” program for Monte Carlo simulation of the two-dimensional Ising model with animated graphics. Here are working versions of the program in the following languages:
All of these are provided as source code, so you can modify them to work Problems 8.26 through 8.32 and perhaps add other features.
Last modified on March 5, 2015.