
Summary
The student investigates basic properties of spectra in the lab using emission tubes and spectroscopes.
Background and Theory
Astronomy is nearly entirely a study of light. From this single source of information, we can often find the physical conditions, compositions and processes in distant objects.
A plot of the brightness of an object versus wavelength is called a spectrum, (pl. spectra), and is observed using a spectrograph. By spreading out the light by wavelength, we can gain insight into what's happening to photons of particular wavelenghts (or energies), which in turn tells us what's happening with particular types of atoms.
There are three components of a spectrum: continuum emission (or blackbody radiation), emission lines, and absorption lines.
- Continuum emission is a wide, smooth (continuous!) band of colors like a rainbow. This type of emission is caused by a opaque material which emits radiation because of its temperature. Hotter objects are brighter and bluer than cooler objects. All objects have continuum radiation. (Even you, although in your case, since it's in the infrared, we usually call it 'heat'.)
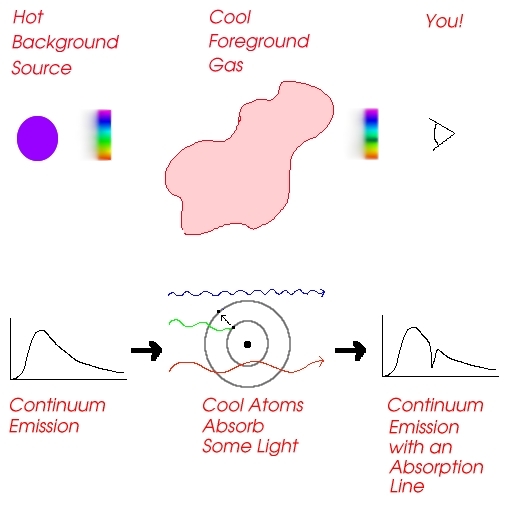
- An absorption line is characterized by a lack of radiation at specific wavelength. Absorption lines are created by viewing a hot opaque object through a cooler, thin gas. The cool gas in front absorbs some of the continuum emission from the background source, and re-emits it in another direction, or at another frequency. Absorption lines are subtracted from the continuum emission, so that they appear fainter.
- An emission line is characterized by excessive radiation at specific wavelengths. Emission lines are added to the continuum emission, so that they appear brighter. You can observe emission lines by looking at the cool gas (that caused absorption lines above) from the 'side', away from the background source. Some of the photons that were redirected in the production of absorption lines will come your way, but there will be only small amounts of continuum radiation (the gas is cool, remember).
The important thing to know about absorption and emission lines is that every atom of a particular element (hydrogen, say) will have the same pattern of lines all the time. And the spacing of the lines is the same in both absorption and emission, only emission lines are added to the continuum, while absorption lines are subtracted.
In this lab, you will be using spectrometers to look at various elements which have been heated so that they have many emission lines. You will also observe emission from continuum sources, and from combinations of elements. As you look in the narrow end of the box, look for the wavelength scale inside: 4 through 7 denotes a wavelength scale of 4000Å through 7000Å The calibration is not very accurate, but usually good to within a few hundred Å.
Procedure
Print out the Worksheet.
- Examine each of the light sources in the table on the worksheet
(not necessarily in order!). Write down what type of spectrum you see (continuous, emission, absorption). Draw the spectrum you see roughly on the scale. Try to draw a distinction between sharp and fuzzy lines, bright and faint lines, and regions where continuum is bright and faint. Fill in the spaces (above the numbers 4, 4.5, 5, 5.5, etc.) with the color you perceive or no color.
Helium, Hydrogen, Mercury, and Neon lamps all excite a thin gas. The incandescent lamp glows from thermal emission of a hot metal filament. When observing daylight, look out the window at the sky (clouds are best). Never look directly at the sun with your spectroscope!! To observe the fluorescent lights, step outside into the hallway so the classroom may remain dark for the faint gas lamps.
- Examine the mystery gas and compare its spectrum to those on the spectral
chart. What is the mystery gas?
- The fluorescent overhead lights are also gas lamps, although a white fluorescent coating has been placed on the glass of the tube. This coating smears out the spectrum and converts some blue light to redder light, in order to more closely simulate natural light. Use your spectroscope to identify one of the gases in the lamps which is also present in the overhead lights.(Recall that a certain pattern of strong lines is the signature of a specific gas.)
- While observing either daylight or the incandescent lamp, take each of the three filters (separately!) and move them in and out in front of your spectroscope's slit. Describe what you see for each of the three filters.
- Promotional signs are often made of lit, colored tubing. These are commonly called neon lights. However, you have seen here that excited neon gas emits a distinctive spectrum and appears orange to the eye. How do you suppose a sign which includes blue and white lettering is made?
- You have learned in the classroom that our Sun displays an absorption line spectrum. Examine the solar spectrum carefully and locate the dark absorption lines. At what wavelengths do they appear?
- Describe the difference in appearance between absorption and emission lines. Draw a diagram of a spectrum with a few of each, and label them.
- Now describe the difference in the physical mechanisms responsible for absorption and emission lines. Draw a diagram of an atom absorbing a photon, and a diagram of an atom emitting a photon.
- How are emission lines different from continuum radiation? Draw a diagram to help explain what you mean.
© 2003 Weber State University
Revised: 24 April, 2003