Summary
This lab teaches the basic techniques and criteria of the Morgan-Keenan system of spectral classification. The student examines and classifies the spectra of 10 stars. The behavior of absorption lines and the continuum radiation is also examined.
Background and Theory
Classification lies at the foundation of nearly every science. We are all aware that biologists classify plants and animals into subgroups called genus and species. Geologists also have an elaborate system of classification for rocks and minerals. Scientists develop classification systems based upon perceived patterns in and relationships among natural objects. Astronomers are no exception. They classify planets as terrestrial or Jovian, galaxies as spiral, elliptical or irregular, and stars according to the appearance of their spectra. In this exercise, you will study the method that astronomers use to classify stars by their spectra.
A spectrum of a star is composed of its continuum emission as well as a number of 'lines' which can be either emission or absorption lines. The continuum emission is a product of the blackbody radiation at specific frequencies, caused by electrons in atoms dropping down into lower energy levels. They can also be caused by molecular transitions to lower energy levels. This sort of line appears brighter compared to the region of the spectrum around it. Absorption lines cause dark features in the continuum emission where the radiation is removed. This is caused by atoms (or molecules) absorbing radiation, and moving to a higher energy state. This process causes the lines to look darker when compared to the region of the spectrum around them.
Stars come in a wide range of sizes and temperatures. The hottest stars in the sky have temperatures in excess of 40,000 K, whereas the coolest stars that we can detect optically have temperatures on the order of 2,000-3,000 K. The appearance of the spectrum of a star is very strongly dependent on its temperature. For example, the very hottest stars (called O-type stars) show absorption lines due to ionized helium (He II) and doubly or even triply ionized carbon, oxygen or silicon. On the other hand, the coolest stars (M-type) show lines produced by molecules.
Procedure
- Print out the worksheet.
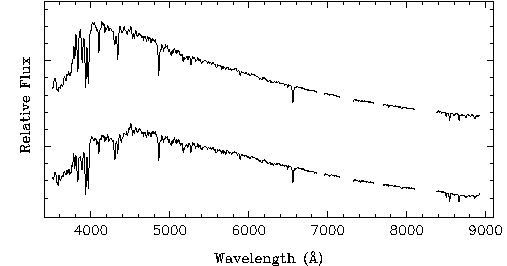
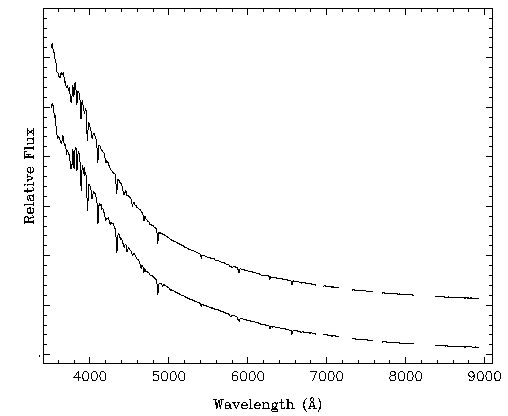
- Examine each of the panels below. Each contains two or more stars that have been grouped together because their spectra are similar.
Panel 1
Panel 2
Panel 3
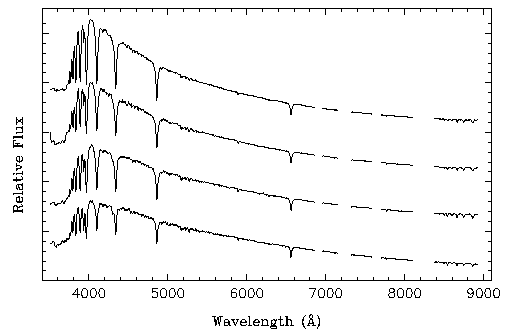
Panel 4
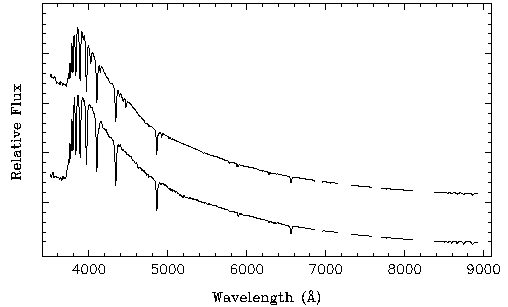
Panel 5
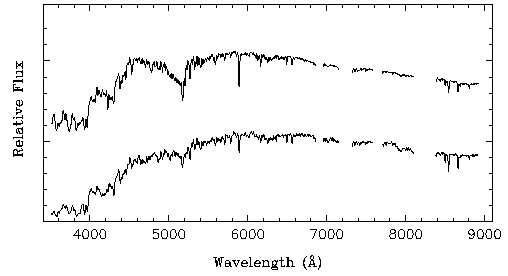
Panel 6
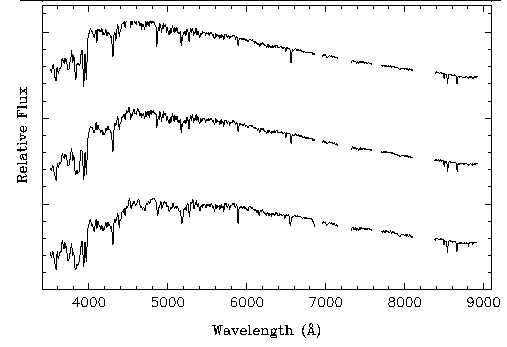
- Describe these spectra. Are there deep absorption lines? Broad absorption lines? Are all the lines in a panel about the same depth? Do the spectra all peak at the same wavelength in a given panel? In different panels? Describe the spectra in each panel, including any other features you might note.
- The lines at about 4340 and 4860 angstroms are critical lines for classifying stars. These are two of the Balmer lines of hydrogen, in which the atom is making a transition up from the second energy level. Put the panels in order of strongest to weakest Balmer lines. Assign the strongest panel the letter A, next strongest B, next F, K, M, and the weakest O.
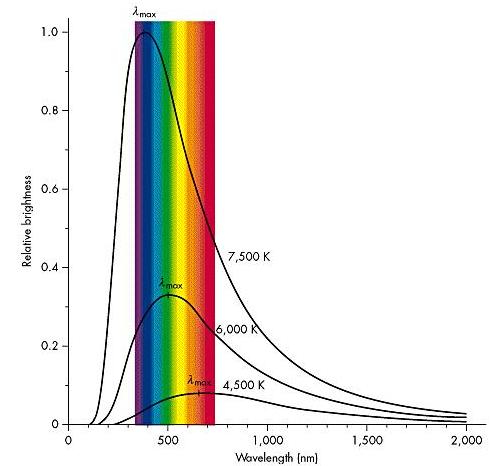
- What is the peak wavelength (
 max) of the continuum emission in each panel?
- Which panel has the hottest stars? Which panel has the coolest stars? Put all the panels in order of hottest to coolest stars.
- Are your lists from step 4 and step 6 the same? In what order should the letters go now? This is the famous M-K classification scheme. Originally, the spectra were ordered by the strength of the lines. Then it was discovered that the strength of the lines could also tell you something about the temperature of the star, and the classes were re-ordered.
- But why do O stars and K stars BOTH have weak lines? To answer this, we need to know more about absorption lines. Absorption lines occur when an electron absorbs energy from the spectrum to move up the energy levels in the atom. Since hydrogen has only one electron, this electron is usually in the ground state. But as the temperature rises, the average electron gains more energy from collisions with other atoms, moving up to the second energy level, then the third, and so on. If the gas is hot enough, the electrons leave the atom entirely, so that it becomes ionized. There is a particular temperature at which the average electron will be in the second energy level. At this temperature, there are LOTS of atoms which can absorb Balmer line photons from the spectrum, and therefore stars of this temperature will have the strongest Balmer lines. Which spectral class corresponds to this temperature?
- To find out what the actual temperature is, we need one more step. Using the peak wavelength (max) of the spectral type from step 8, and the following formula, find the temperature of the star with the strongest Balmer lines.
max=2.9x10⁷/T.
where max is in angstroms, and T is in Kelvin. What is the temperature at which the Balmer lines are the strongest? What happens to the Balmer lines at higher temperature? What happens to the Balmer lines at lower temperature?