
Summary
Images of the Sun are used to find the rotation period of the Sun, and to find the velocity of matter leaving the Sun through a coronal mass ejection.
Background and Theory
The rotation period of an object is the time it takes to spin on its axis once. For example, the rotation period of the Earth is one sidereal day. In order to observe the rotation period of any rotating sphere, we can measure how many degrees of longitude a surface feature moves in a given time interval. We then solve for the period by taking the ratio of one full rotation (360 degrees) to the observed angular motion, and multiplying by the time interval. For example, if we observe that a given feature moves 30 degrees of longitude in 2 hours, then the rotation period is:
Period=(2 hours)X(360/30)=24 hours.
This method can be applied to the rotation of the Sun by observing active regions as they are carried across the disk by the Sun's rotation.
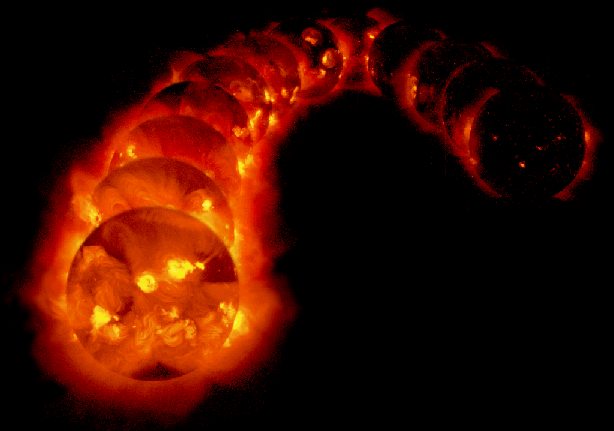
Active regions of the Sun come in a number of varieties, such as sunspots, flares, and prominences. All active regions have large magnetic fields. Sunspots are relatively cool areas of the Sun which stand out from the rest of the surface because they are relatively dark. The temperature of a sunspot is about 4200 K compared to a temperature of about 5500 K for the rest of the Sun. If we could see the spots in isolation, they would appear bright red. Flares occur in regions of the Sun where the magnetic field is twisted very tightly by the differential rotation of the Sun. This magnetic twisting then releases energy. These active regions emit very high energy light, such as X-rays. Prominences are regions of cool gas in the corona of the Sun. When seen against the disk, these appear as dark filaments, but when seen above the Sun's limb, they can be very bright. Coronal mass ejections are caused by the eruption of prominences, and are blasts of gas which move out through the Sun's corona into the rest of the solar system. You can see this in this (large!) 12 day video of the Sun.
Procedure
Print out the worksheet.
Part A: The Rotation Period of the Sun
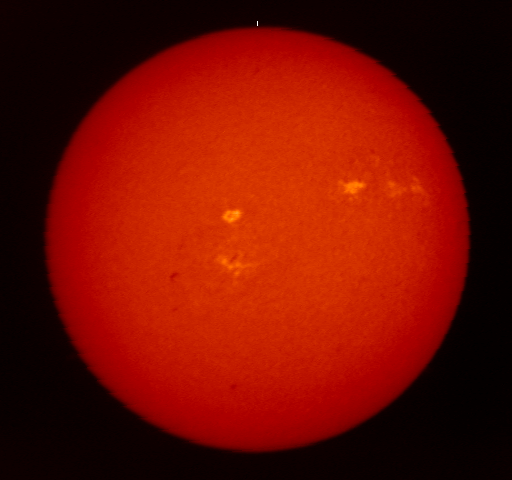
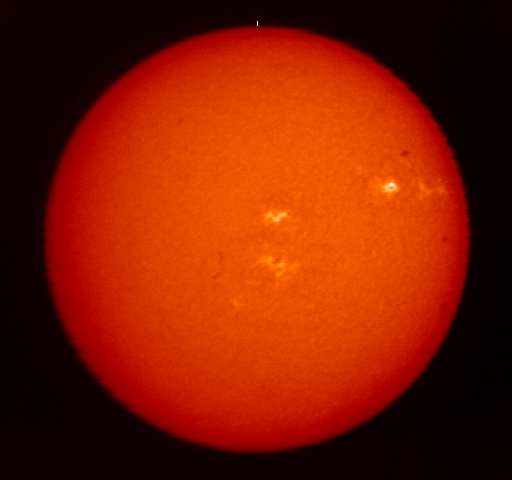
- Examine the two images of the Sun below. They were taken 1 day apart.

 Notice the bright active regions and the dark sunspots in each image. In which compass direction do the regions move over one day? (Hint: the thin white line at the top of the image indicates North.)
- Make a diagram of the Sun-Earth system, showing the rotation of both the Sun and the Earth, as well as the revolution of the Earth about the Sun. What can you say about all of these motions? Comment on a possible reason for any similarities or differences.
- Find the image scale for the image. To do this, measure the diameter of the Sun in pixels. (Need help remembering the distance formula? Check this quick review!) Divide the actual diameter of the Sun in km (1.4 million km) by the diameter in pixels to get the image scale. This is similar to finding a scale on a map...
- Choose one of the active regions near the Sun's equator. Make sure that it is recognizable in both images. Use these images to find the distance, x, (in pixels) that this feature moved between the two images (need the distance formula again?).
- Multiply by the image scale from step 3 to find the actual distance, D moved by the active region.
- Since the spots are always moving at the same velocity, the period of the rotation of the Sun can be found using a ratio. A point on the surface of the Sun near the equator rotates all the way around the circumference of the Sun, 2*
 *R, over the course of one orbital period. The images you are using were taken one day apart. The ratio of the times must equal the ratio of the distances as follows:
 Calculate the period, P, of the Sun in days. (D is the actual distance calculated above.)
- Estimate the uncertainty of your measurements (in pixels). For example, do you think your measurement was accurate to one pixel? two pixels? eight pixels? This is your uncertainty. Use the following formula to estimate your fractional error:
fractional error=(uncertainty)/x
x is the distance moved by the sunspot (in pixels).
- To find the corresponding error in days, multiply by the period. Report the period as the number you calculated +/- your error. For example: 28+/-3 days.
Part B: Solar Prominences
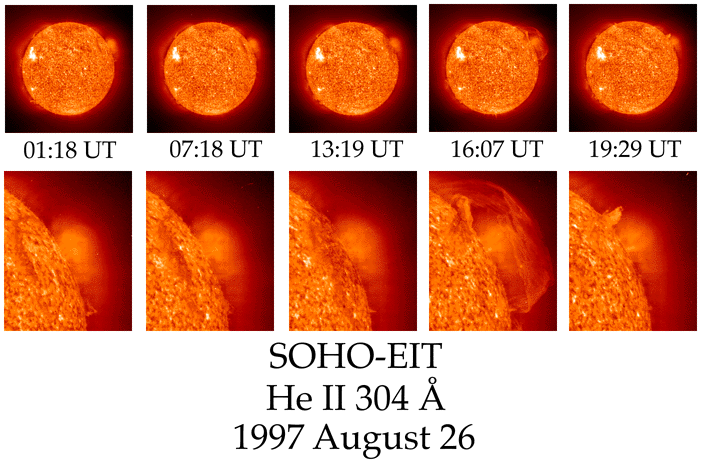
- Examine the image below, which shows the development of a solar prominence over time.

- Now, find the image scale for the top set of frames as in step A3 above. (All of the subimages in the top row have the same image scale.)
- Measure the minimum height (in pixels) of the prominence, as shown in the first upper frame. Multiply by the image scale to get the minimum height in kilometers. You will need the distance formula.
- Measure the maximum height (in pixels) of the prominence, as shown in the fourth upper frame. Multiply by the image scale to get the maximum height in kilometers. Again, you will need the distance formula.
- Find the growth of the prominence by subtracting the minimum height from the maximum height.
- Find the time between the frames (in hours) by subtracting the times, which are given in hours and minutes of Universal Time.
- Find the velocity of the material as it leaves the Sun by dividing the growth of the prominence by the time interval between frames 1 and 4. Convert this velocity from km/hr to mi/hr, a scale which may be more familiar. (1.6 km = 1 mile). Is this velocity fast or slow compared to the speeds of objects you are familiar with (for example, cars or jet planes)?
© 2003 Weber State University
Revised: 24 April, 2003

 Notice the bright active regions and the dark sunspots in each image. In which compass direction do the regions move over one day? (Hint: the thin white line at the top of the image indicates North.)


 Notice the bright active regions and the dark sunspots in each image. In which compass direction do the regions move over one day? (Hint: the thin white line at the top of the image indicates North.)
