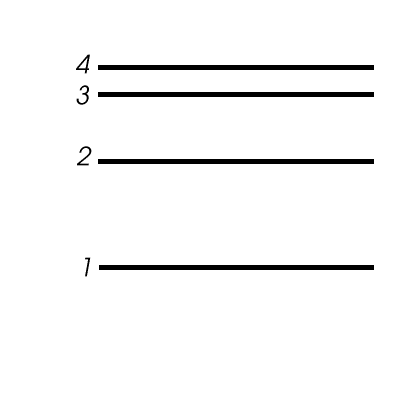
- Assume an emission spectrum and draw arrows indicating the
possible transitions.
- How many spectral lines will result from all possible
transitions among these levels? __________
- Which transition corresponds to the highest frequency
(shortest wavelength) light emitted?
From n = _______ to n = ________ .
- Which transition corresponds to the lowest frequency
(longest wavelength) light emitted?
From n = _______ to n = ________ .


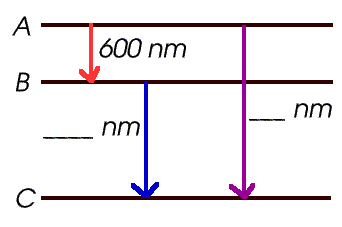
- What is the wavelength emitted when the electron jumps
from A to B? _____________
- When it jumps from A to C? _____________

