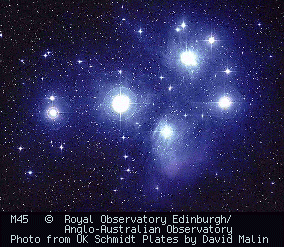
Cluster Color-Magnitude Diagrams and the Age of Stars


Summary

The student will find the ages of two clusters by plotting stellar data on a color-magnitude diagram.

Background and Theory

In class we have touched on many characteristics of stars: their distance, intrinsic luminosity, surface temperature, composition, mass and radius. However, this tells us very little about their actual histories. In order to study the life cycle of stars, we would like to know the age of the stars we observe. Star clusters give us an opportunity to determine the age of their member stars, because we can assume that all the stars were born at roughly the same time.

Normally, a Hertzsprung-Russell (H-R) diagram plots the spectral type of a star (or its temperature, which is equivalent) against the star's intrinsic luminosity (or absolute magnitude). However, in this lab we are going to construct a slightly different kind of H-R diagram, one which features the color of stars.

This isn't as easy as it sounds. Think, for example, of how hard it is to get two people to agree on the exact color of a sweater. Now imagine if we had to get all astronomers to agree on the color of every object in the sky! To avoid this situation, astronomers measure the brightness of a star through filters. A filter only lets light of specific wavelengths through. For example, if you were to look through a red filter, everything would appear different shades of red, because only red wavelengths of light can pass through the filter and into your eye.

Astronomers like to compare the brightness of a star (or anything, really) in one filter to its brightness in a different one. Since stars are blackbodies they will appear brighter in one filter than in another, and the difference between these brightnesses is a number which we use to describe the stars' color. Using this technique allows us to give color a universal meaning.

Since color and temperature and spectral type are all equivalent, we can plot the color of a star against its brightness (measured in magnitudes) as a way of building an H-R diagram without taking the star's spectrum. This type of H-R diagram is called a "color-magnitude" diagram. This method is particularly useful with star clusters where taking the spectrum of thousands of closely-spaced stars would be impossible.

Today we will be plotting actual data for two star clusters: an open cluster called M45 and a globular cluster called 47 Tuc. Each cluster contains thousands of stars, but we will only plot the data for a representative few. The table below provides the data.

The filter combination we will use is B-V: the difference between the star's brightness in a blue filter and in a yellow filter. The important thing to know is that the bigger B-V is the redder the star is -- and the smaller it is, the bluer the star.

Procedure
    Globular Cluster 47 Tuc.  Image taken with the 1.5 m telescope at Cerro Tololo, Chile, by Bill Keel, Ray White III, and Chris Conselice
  1. Look at the pictures of the two clusters. How are their structures different?
  2. Plot B-V versus magnitude for each star on a piece of graph paper. Use a different plot or a different color for each cluster. Your x-axis is the color (B-V), and runs from -0.4 to +1.6 in both plots. Your divisions should be about 0.2. The y-axis is the apparent magnitude, and is different in each case. Check the numbers in the table to see what your maximum and minimum values should be. Don't forget that magnitudes are backwards, so that smaller numbers mean brighter stars!!!!
  3. We usually plot absolute magnitude or luminosity on the y-axis of an H-R diagram. Why can we plot the apparent magnitude for cluster stars? (Hint: what's the difference between apparent and absolute magnitude?)
  4. On your plot for 47 Tuc, identify the red giant stars (just draw an oval around them all). Why are these stars so much brighter than main sequence stars of the same color?
  5. The lifetimes of different spectral types are given in Table 2. Use these lifetimes to estimate the age of 47 Tuc and M45. Explain your reasoning!
  6. Why don't we see O and B type stars on these diagrams (B-V < -0.2)?

Table 1: Data for 47 Tuc and M45 Table 2: Main Sequence Lifetimes
47 Tuc       M45    
Star Number Magnitude Color (B-V)   Star Number Magnitude Color (B-V)
10012 19.6 0.76   133 14.4 1.28
10170 20.6 0.98   165 7.6 0.12
10200 21.0 1.05   345 11.6 0.84
10206 21.0 0.96   522 11.9 0.90
10278 21.6 1.23   697 8.6 0.35
10335 22.0 1.31   804 7.9 0.20
10359 22.2 1.23   950 4.2 -0.10
10489 22.6 1.33   1040 15.8 1.44
10610 23.0 1.45   1103 14.8 1.47
20028 17.6 0.53   1234 6.8 0.02
20034 17.7 0.58   1266 8.3 0.36
20049 18.0 0.57   1305 13.5 1.18
20070 18.4 0.60   1309 9.5 0.47
20104 18.8 0.65   1355 14.0 1.23
20130 19.1 0.69   1432 2.9 -0.09
20185 19.8 0.83   1454 12.8 1.16
20210 20.1 0.88   1516 14.0 1.31
20239 20.4 0.93   1766 9.1 0.47
20335 21.4 1.10   1797 10.1 0.56
20364 21.6 1.20   1924 10.3 0.62
30014 13.5 1.10   2168 3.6 -0.08
30103 15.5 0.82   2181 5.1 -0.08
40002 12.0 1.45   2209 14.4 1.47
40022 12.6 1.25   2406 11.1 0.76
40043 12.9 1.14   2425 6.2 -0.05
40130 14.0 0.99   2588 13.1 1.22
40135 14.0 0.69   2601 15.0 1.55
40144 14.0 0.79   2655 15.5 1.36
40164 14.0 0.59   2870 12.5 1.07
40351 14.9 0.85   2881 11.8 0.86
40628 16.2 0.73        
40821 16.6 0.73        
41051 16.9 0.70        
41107 17.0 0.58        
41456 17.2 0.51        
Spectral
Type
Color
B-V
Lifetime
(years)
O -0.4 < 106
B -0.2 3 X 10⁷
A 0.2 4 X 10⁸
F 0.5 4 X 10⁹
G 0.7 1 X 10¹⁰
K 1.0 6 X 10¹⁰
M 1.6 >1011

© 2003 Weber State University
Revised: 24 April, 2003