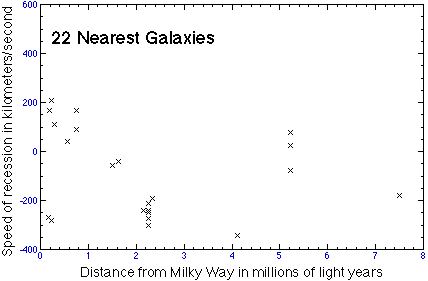
Is the tranquil universe that we observe in the warm summer skies really a universe peacefully at rest? You have heard that it is not; other people and your teachers claim that it is expanding. Frankly, any rational, thinking, observant person would be puzzled by this assertion. Just look up on a clear night. There isn't a trace of direct sensory evidence to support such an outlandish-sounding notion.
So, you might reply, perhaps the Universe expands so slowly that the effects are not noticeable on scales of a century or more. I would reply that there's an equal possibility that the Universe is contracting, or that the motions of galaxies are slow and random (turbulent). To resolve these conflicts we need to gather some evidence. This brings us to the 1920s and Edwin Hubble. Hubble was exploring the distances to whirlpool nebulae --- what we now call galaxies. He had vast amounts of time on a huge new telescope. Hubble and his contemporaries devised new methods to estimate distances to galaxies, some of which required spectra of the light from galaxies to be measured. Once the spectra were obtained, Hubble was very surprised to note that the fainter, more distant galaxies had larger redshifts. Indeed, the pattern was best observable by selecting a class of objects that have the same shapes (so that he could be fairly certain that the objects were intrinsically the same kinds of galaxies). Then all you have to do is to plot the redshifts of those galaxies against their brightnesses. Let's see what you think. Here are modern velocity-distance graphs for three samples of galaxies.
Recall our earlier
discussion of the properties of stars. We found that the H-R diagram changed,
depending on which sets of stars we analyzed. That is, data selection procedures
will affect (bias) the patterns one finds in the data as well
as the interpretations of these patterns.
So to be cautious, we've selected the galaxies for the velocity-distance
plots in three different ways.
Work with a partner. In the spirit of interpreting patterns in the data, carefully consider the graphs above and the biases in the way the galaxies were chosen. Next, sketch what you would expect for the velocity-distance graph if the Universe were static (all galaxies locked in place with respect to each other), turbulent (galaxies moving randomly with respect to each other), rotating (galaxies moving like planets around the Sun), uniformly expanding (galaxies moving apart in such a way that they maintain their relative positions while receding from each other), and uniformly contracting (as for expanding, but all galaxies approaching). You might also consider some hybrid models, such as a rotating universe with small random motions of galaxies.
Now you interpret the data patterns. What is the simplest cosmological model consistent with the observations? Keep this in mind: the Universe behaves in only one way. Whatever interpretation you prefer, be sure that it accounts for all of the data in the three graphs, or at least as much of the data as possible. WHAT TO TURN INFirst, prepare schematic velocity-distance graphs of your expectations for a static, turbulent, rotating, expanding, and contracting universe. You can put all of these on the front side of a sheet of paper with your name and section on it. Then, on another sheet (or the reverse side of the first sheet), very clearly and concisely state your conclusion(s) about the state of the universe's global motions based on your interpretation of the data shown in the three graphs above.