
Summary
The student observes and records a continuous spectrum and the emission lines
of various gases, identifies a particular gas based upon its emission
spectrum and identifies the composition of a "star" based upon its absorption
spectrum.
Materials
- Rainbow glasses or slide-mounted grating
- Colored pencils or crayons
Background and Theory
In many respects, light exhibits a wave-like behavior. As with waves in water,
this means light waves have a velocity (c in a vacuum; 300,000 km/s),
a wavelength (lambda), and a frequency (nu). The
distance a light wave travels in one second is its velocity, expressed
in meters per second (m/s); the distance between two wave crests
(or troughs) is the frequency (number/second).
velocity = wavelength * frequency
is the fundamental relationship between these three quantities |
Wavelengths shorter than those corresponding to infrared light are usually
measured in nanometers. One nanometer is one-billions of a meter
(1 nm = 10-9 m). The wavelength of the light determines the
color. A wavelength of around 650 nm corresponds to red light; 500 nm, to green
light; 450 nm, to blue light. The human eye responds to the wavelength range
of around 400 - 700 nm.
 |
| 300 nm | 400 nm | 500 nm | 550 nm | 575 nm |
600 nm | 625 nm | 650 nm |
A transmission grating is a piece of transparent glass or plastic
ruled with many finely spaced lines. A grating will break up light into a
spectrum just like a prism, but will form multiple spectra. The image of
the object will go straight through the grating, forming what is known as the
zeroth image. The spectrum formed beside the zeroth image is
called the first-order. The next one out is called the
second-order, etc. As one looks toward the higher-order
spectra, the spectra become become fainter and more dispersed (spread out).
A rainbow is formed when rain drops break the Sun's light into the
component colors. Light passing through a prism also forms
a rainbow, but in this case we call it a spectrum (plural:
spectra). A spectrum of the Sun or a light bulb (both approximately
behaving like blackbodies will have all of the colors of the rainbow.
These spectra are called continuous spectra.
Procedure
Print out the Worksheet.
Part 1: Pre-exercise Exercise:
- Fill in the blanks and answer the questions in Part 1 on the worksheet.
Part 2: Observing Spectral Lines in the Lab
- Your instructor will place a clear plastic box containing antifreeze
on the overhead projector -- magically transformed into a large
spectroscope1 -- and project the light from the projector, through a
slit in a piece of cardboard, through the antifreeze, and through a
large diffraction grating onto the screen.
Describe the spectrum of colors before and after the antifreeze is placed
in the light path. Comment on the relative intensities of each color.
- Your instructor will place various colored filters over the slit.
Describe what happens for each filter.
- Practice viewing -- discuss the following observations with your
teammates:
- Using a slide-mounted grating or a pair of "rainbow"
glasses, observe any light source.
Can you see the first order spectra, one on each side of the
zeroth order? What do you need to do to see the two spectra?
How do the colors of the two first-order spectra differ? Can
you see a second order spectrum? Second orders are hard to see
as they must be viewed way off to each side and are faint.
- Optional Use a quantitative spectroscope to observe a light bulb, a
neon light, or a street light. Look about 15 degrees to the side
of the zeroth image to see the wavelength scale. What wavelength
range do you see?
- Continuous spectrum: use the colored pencils or crayons and sketch the
spectrum seen of an ordinary light bulb; for example, that used in an
overhead projector.
| |
| 400 nm (blue) | 500 nm |
600 nm | (red) 700 nm |
- Make a sketch of each spectrum from the gas discharge tubes. Be sure
to reflect the correct intensity of each line, the correct spacing, the
relative positions, etc.
| Note: If all of the spectra look exactly the same, or you
do not see a large number of red lines for neon, you may be using the
spectroscope incorrectly or your spectroscope may be faulty. Check with
your instructor. |
| Type of Gas | Sketch of the Spectrum
|
| | |
| | |
| | |
| | |
| Wavelength |
400 nm |
500 nm |
600 nm | 700 nm |
- Your instructor will insert an unknown gas emission tube
into one of the power boxes. Examine the pattern and colors of the
emission spectrum, mentally compare it to the gases you just observed.
What is the unknown gas? ______________
Part 3: Questions
Answer the following questions on your worksheet.
- Comment specifically on the similarity and differences of each of the
spectra that you have observed. Include in your comments the colors you
observed and how the spacing of these colors differed.
- Examine the following spectra:
| Artificial Solar Spectrum |
 |
 |
| Laboratory Spectum of Iron |
What is the evidence for the claim that iron exists in a relatively
cool outer layer of the Sun?
- How does the light that astronomers see from distant stars and
galaxies tell them that the same atoms with the same properties exist
throughout the universe? Why are spectral lines often referred to as
"atomic fingerprints"?
- How can a hydrogen atom, which has only one electron, have so
many spectral lines?
- Distinguish among emission spectra, aborption spectra, and
continuous spectra.
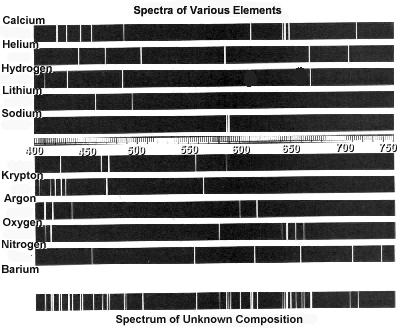
- Examine the following spectra:
What elements are present in the object that produced the "Spectrum
of Unknown Composition"? Explain your method and relate this
activity to the way astronomers use spectra to identify the composition
of a star.
1 To find out more about this 'magical' transformation, see Philip M. Sadler. Projecting Spectra for Classroom Investigations. The Physics Teacher, 29(7), 1991, pp. 423
© 2003 Weber State University
Revised: 24 April, 2003