
Summary
The student finds the distance to the globular cluster, Messier 4 (M4), using
observations of an RR Lyrae star and the mean absolute magnitude of RR
Lyrae variables.
Background and Theory
As stars evolve, their atmospheres become unstable and the star becomes
intrinsically variable. These stars can vary erratically, semi-regularly, or
regularly. Two special classes of variable stars are used to determine
distances within our galaxy and distances to neighboring galaxies. Cepheid
variables have periods that range from a few days to a few hundred days. They
are evolved Population I stars and lie within the spiral arms of a galaxy.
RR Lyrae stars (named after the prototype star RR in the constellation
Lyra) are evolved population II stars and can be seen in the halos of
galaxies, especially in globular clusters. Periods of RR Lyrae stars are
typically 0.5 to 1 day, making it possible to see one or more periods in a
single night of observations.
 Through calibration of hundreds of RR Lyrae stars, we find they have a mean
absolute magnitude of 0.75. We can calculate the distance to an RR Lyrae and
thus the globular cluster from the distance-magnitude relation:
d = 101+0.2(m-M)
In this exercise, we will use the calibration and the distance-magnitude relation to determine the distance to the globular cluster, M4.
At right is an image of M4. One of the stars in M4, #42 in a list of the
variables found there, is identified with horizontal bars. You will find a
series of 20 pictures of #42 and its neighboring
stars in a figure accompanying this lab. These 20 pictures were taken over
the course of one night. Star #42 is easy to spot as it is obviously changing
size (therefore luminosity---Why?) between frames, but if you do not see it
right away, it is at the center of each photograph.
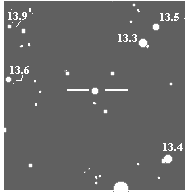
To determine the magnitude of a star, astronomers choose a number of
standard stars within each frame and calibrate the variable star
against these standards. We will do a similar process here. Within these
frames are four standard stars. You can identify them from the reproduction
of the field around Star #42 shown at right.
This is a computer reproduction and not true to scale. Use it just to identify the standard stars.
Procedure
Print out the worksheet
- Find the standard stars corresponding to those in the image above on the
sheet with the 20 images.
- Measure the diameters in millimeters of the stars on that sheet.
- On a separate sheet of graph paper, plot the apparent magnitude of each
standard star (y axis) as a function of its diameter
(x axis). Your graph should have magnitude 13.0 (bright) at the top
of the y axis and 14.0 at the bottom. Draw a best-fit line through the
points (remember, the lab on Scientific Methods?). This graph will be used
to calibrate the magnitude of the variable star in each frame.
- Measure the diameter, in mm, of the variable star in each of the
frames. The frames have been randomized to avoid biased measurements. Write
the diameters, D1, in column 3 of
Table 1.
- When finished with these measurements, have your partner take a second
series of 20 measurements and write the diameters, D2, in column 4
of Table 1. Average the two diameters for
each frame and write the averages, D (ave), in column 5.
- Using your calibration of apparent magnitude versus diameter, interpolate
the apparent magnitude for the variable star for each frame and
record in Col. 6.
- Plot magnitude vs. time (where the time is given in the fraction of the
day since the observations started) on graph paper. Draw a smooth curve
through the data points (do not simply "connect-the-dots").
© 2003 Weber State University
Revised: 24 April, 2003

 Through calibration of hundreds of RR Lyrae stars, we find they have a mean
absolute magnitude of 0.75. We can calculate the distance to an RR Lyrae and
thus the globular cluster from the distance-magnitude relation: