Schematic of distance tools.

Summary

This exercise demonstrates three of the major distance measuring techniques: radar, parallax, and "standard candles" (both linear size and luminosity).

What you need

A wristwatch or clock, paper, pencil, a ruler

Background and Theory

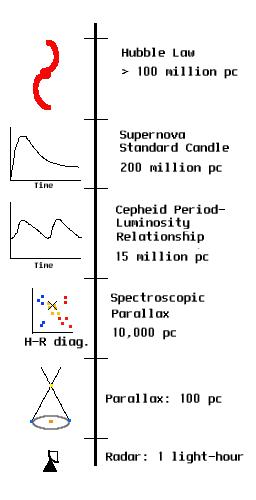
One of the most difficult problems in astronomy is determining the distances to objects in the sky. There are four basic methods of determining distances: radar, parallax, standard candles, and the Hubble Law. Each of these methods is most useful at certain distances, with radar being useful nearby, and the Hubble Law being useful at the most distant scales.

Procedure

Print out the worksheet.

Part 1: Radar:

Using radar to measure the distance to an object is fairly straightforward, and much like using an echo. Dolphins find their way around underwater in this way, and you judge the sizes of large, dark rooms this way! We are going to simulate radar using a person for the pulse of light.

  1. Find a place outside or along a long hallway that you would like to measure (e.g. the distance between buildings or trees or classrooms). Both partners should begin at the same location.
  2. One of you will be the radar pulse, and the other will be the scientist on Earth. Radar works because we know the speed at which light travels. Because your "radar pulse" will not travel at the speed of light, you need to find the actual speed of the "radar pulse". The "radar pulse" should walk at an even, repeatable speed, and the scientist should measure how far the pulse travels in 5 seconds. Calculate the speed of travel from the distance and the time.
  3. The scientist gives the signal to begin, and the radar pulse begins to travel toward the object. The scientist times the "radar pulse's" trip (both going to the object and returning). When the pulse comes to the object, it "bounces" off, and travels back in the direction it came. The number of seconds elapsed is the total time, T, taken for the pulse to travel out, bounce off the object, and travel back again.
  4. The distance to the object, d, is given by:

    d=s·(t/2)

    (This equation may be more familiar to you if worded this way: the distance traveled is equal to the speed times the time it took to get there. So if you are travelling at 60 mph for one hour, you've traveled 60 miles.)

    In astronomy, a radio telescope is used for the radar dish (the Arecibo Radio Telescope, for example), the radar pulse travels at the speed of light (186,000 miles per second), and much larger distances are involved, such as the distance to Mercury.

Part 2: Parallax:

  1. First, let's play around with this idea a little bit. One lab partner should stand off to the side, and hold a pen in front of the other. Alternately open and close each eye. The pen appears to move relative to the background (the stuff behind it). With one eye closed, try to reach out and touch the pen. It is surprisingly difficult! Now try it with both eyes open. It is much easier! What's happening? Your eyes turn to focus on the pen. This is very obvious when the pen is close to your face, and your eyes are "crossed". Your brain measures the tension in your eye muscles, and knows (from experience) how far they are turned from straight-ahead. In other words, it measures the angles of your eyes. From these two angles, it "computes" the distance to the object. You can watch babies (and drunk people!) learning to do this, as they reach for stuff and miss, and reach again and miss, and reach again and grab it. (Drunk people have a problem because they have a hard time focusing on objects---they've lost their fine motor control, even in their eyes. So the brain has to try to relearn how to judge distances.) Have your lab partner move the pen closer to you. Now when you alternately open and close one eye does the pen appear to move more or less than before? What about when the pen is further away? What does this say about the usefulness of parallax at various distances?

  2. In order to actually calculate the distance in this way, you need to have a background at a distance of "infinity". Of course, things aren't really infinitely far away, just far enough that their parallax is just about zero. You can find your own "personal infinity" by looking at streetlights. What is the furthest streetlight that you can look at, with your eyes alternately open and closed, and still notice it moving relative to, say, things on the horizon, or more distant streetlights? Try this several times---it takes practice! Estimate the distance first by looking, and then pace it off (on average, a persons step is about 3 feet---you can use the grid from part 1 to measure your step-size more accurately). You don't actually need to walk all that way, just pace off the distance between streetlights, and multiply by the number of streetlights to your infinity.

    In astronomy, we use a "baseline" of the diameter of the Earth, or the diameter of the Earth's orbit to measure parallaxes. The baseline is the distance between observation points. In the exercise above, it is equal to the distance between your eyes. The longer the baseline, the more objects move relative to the background, and the parallax can be measured to greater distances. The infinite background is usually a number of stars further away than the star or object in question.

Part 3: Standard Candles:

  1. The first sort of standard candle is uniform in size. For example, when you look down from the top of a skyscraper, you don't say to yourself "Look at all those tiny people!" You say "Look how far I am from those regular-sized people!" In a similar way, we can take astronomical objects of all the same "species", and find their distance by how small they appear in the sky.

    Record your height and that of your lab partner in the chart on the worksheet.

  2. Now you need a measuring tool for angles. But you already have one that you carry with you all the time! Your fist at arm's length measures about 10 degrees on the sky, and the width of your finger at arm's length measures about 2 degrees. Have your lab partner pace off a distance down the hallway, and stand there. Record the distance in the data table. Measure their height in degrees, and have them measure yours. Now move further apart, and record the distance in the data table. Measure their height in degrees and have them measure yours. Do this three times more (for a total of five measurements). Record your results in the table. What do you notice about the angular measurements? Did either of you change in actual height? Suppose that there were a number of people all the same height as your lab partner. Could you tell which people were far from you, and which ones were close by just by looking at their angular size? Could you use this to get a rough estimate of the distance to a galaxy?

  3. Now plot your data on the graph, so that the distance is on the x-axis, and the angular size is on the y-axis. Use a different color or symbol for your own height and that of your lab partner. Are the points randomly sprinkled about, or do they show a relationship? What does this tell you about how reliable this method is for determining distances? Suppose that you used 5 different people at 5 different distances. How would this change your results?

  4. The second sort of standard candle is uniform in brightness. This is how you know how far away a person with a flashlight is at night. You can see that the flashlight is dim, and know they are far away, or see that the flashlight is bright, and know that they are nearby. Once again, you can use streetlights to check this out. Find a stretch of street where you can see the streetlights for a pretty long way. You will need to be able to see about 10 streetlights at once. Look up the street (at night!), and, using the nearest light for your candle, estimate the brightness of each of the more distant lights. The best way to do this is to look for one that seems half as bright, then estimate the rest in between, then find one a tenth as bright (hopefully further than the half as bright one!), and estimate the rest in between. This is very much a guesstimate, so do it once yourself, then have your lab partner do it. Record the data in the form 1, 0.8, 0.65, 0.5... The distance between each of the streetlights should be roughly the same, but take note of any gaps caused by burnt out bulbs, etc. Plot these data on a chart, using distances of 0, 1, 2, 3, 4, 5... for each of the lights in order. Do you notice a trend here? Is it the same as the size trend from the first section of Part 3? That is, is the "shape" of the data the same?

    Should it be?

    There are a lot of sources for error in this portion of the lab. Name a few of them. To get you started, think about the assumptions that we are making about the streetlights. Which of these sources of error also apply in an astronomical context?

© 2003 Weber State University
Revised: 24 April, 2003