Making an Integrated Surface Brightness Profile
As you can tell, figure 2 does not have any data points. It is simply a model of how the brightness of the galaxy falls off with distance. (The reason the curve doesn't fall off is because of the integrated nature of the plot. It is cummulative, so at every radius you are seeing all the light emitted from inside that radius. This was done to make our data consistent with the masses we find using Newton's equations.)
The plot is really a curve. The equation that describes the curve is:
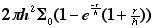 , where h=3.8 kpc, and Σ0=6.725 x 10⁷ solar luminosities/kpc2.
What do h and Σ0 stand for?
h is some scale height.
Σ0 is the peak surface brightness at the center of the galaxy.
What does that mean?
Let's start from the beginning.
You have your galaxy, NGC 2742:
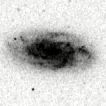
NGC 2742
Obviously, it gets dimmer towards the edge. We are dealing with surface brightness here, which is how much light comes from some area of the galaxy. It is typically assumed that surface brightness can be modeled with a decaying exponential. That means that going out one particular radius, the brightness in each same sized area patch dims as you move outwards. It starts from some high point, Σ0. The point at which it's decayed to 1/e of it's orginal value is the radius h (the scale height). Mathematically, we say:

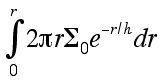
To create our integrated surface brightness profile, we need to integrate that function over radius. Since we're taking account all the brightness inside, we also need to take into account the fact that the galaxy is a disk. That means integrating over the entire circle (thus the 2πr in the below integral).
If you know more math than I do, you will see that this can be integrated by parts and the result is:
(Sorry about all the math, that's just the easiest way to explain the curve in this case.)
In particular, Σ0 comes from the fact that we assume the absolute magnitude
of the center of every spiral galaxy is -21.7 mags/as2. This seems odd, but it
has been noticed through repetitive observation that the center of
spiral galaxies are all quite close
to the same surface brightness (see Persic and Salucci, 1988 if you don't believe me). You need to convert magnitudes to surface brightness
units and arc seconds to kpc. Since the value is an absolute magnitude, that means
it's the brightness 10 pc away. I'll leave as an exercise for the student using
the magnitude equation to convert magnitudes to luminosities, and using the small
angle approximation to convert arc seconds to kpcs. I did get tripped up on the units
the first time I did it.
Persic, M., Salucci, P. 1988, MNRAS, 234, 131
It sounds like you cheated
Yep, we took the easy way out. Andrew West claims that you could use pictures from
the Sloan Digital Sky Survey (SDSS)
to create a surface brightness profile. While I admit that it wouldn't be hard to
just plot how the brightness falls off with area (thereby getting real values for
our two parameters), it would be a trigonometric mess to try to photometrically integrate over the
concentric rings to find an integrated surface brightness profile. There might be
some simple trick that aleviates the problem I'm talking about. Anyways, it was
reasonably easy to look on NED
to find the reference mentioned above.