Introduction
No celestial phenomenon is as powerful as a supernova explosion, and
few objects in the sky have been studied as much as the Crab Nebula and Pulsar. When observing the Crab, we view tremendous forces and energy at work, things that could never be recreated here on Earth. The story of the Crab starts in the year A.D.1054, when the Chinese astronomers spotted a brilliant new star that blazed brighter than all other stars and even the planet Jupiter. We know today that this "guest star" was the explosion of a star much more massive than our Sun.
The Crab Nebula consists of a pulsar surrounded by a bright diffuse nebula. A pulsar is a rapidly rotating neutron star that happens to beam radiation in our direction as its magnetic axis is offset from its rotation axis. The nebula is about six light years across. It is expanding at roughly 5 million kilometers per hour. If the nebula were located at our Sun's position, it would take a little over a day for the expanding gas to reach us!
Read this part of the lab carefully.
It summarizes how a massive star spends the last years of its life,
and the processes involved in the supernova explosion. Try to picture
the events described as you read. When you are finished with your
reading, take a blank, white sheet of paper and make two sketches:
1) how you think the explosion will look immediately after it happens and
2) how it will look 1,000 years into the future. If you are so inclined,
you may use more than pencil and paper: colored pencils, crayons,
charcoal, paint, whatever.
Don't go onto the second or third part of the lab until you have
completed the first part. Your pictures will serve as your prediction
as to what to look for when hunting down a supernova.
For additional background on supernovae, it is strongly recommended
that you check out the site that covers numerous violent acts in the
Universe, including Type I and Type II supernovae.
After you have made your sketches. Go on to read more about the Crab nebula. Do some preliminary study of the images included in this section.
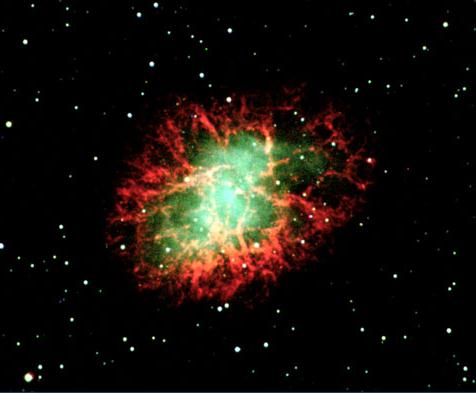
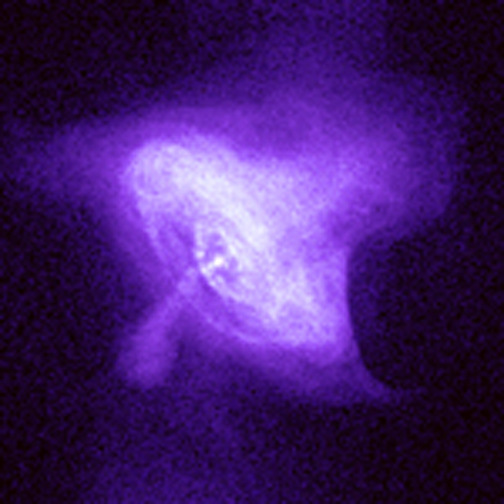
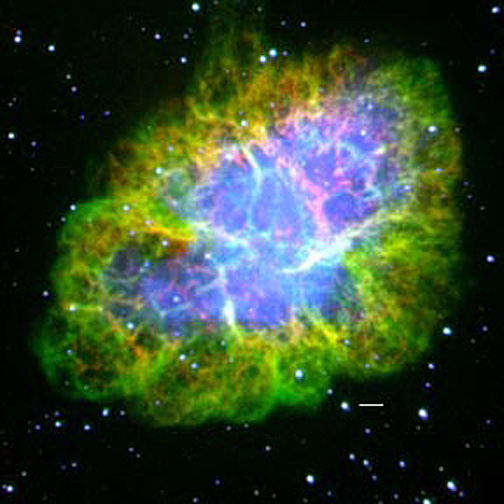
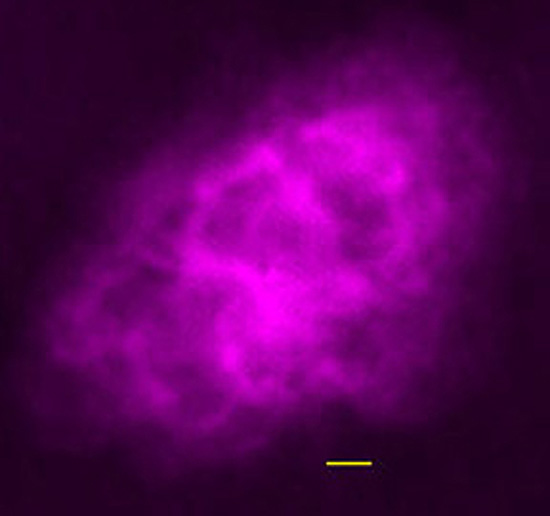
Both the nebula and the pulsar are bright sources of radiation at all wavelengths. The radiation is produced mainly by high-energy particles accelerated by the energy of the neutron star. These energetic particles spiral around magnetic field lines in the nebula and give off radiation by the synchrotron process.
Comparing the X-ray, optical, infrared, and radio images of the Crab shows that the nebula appears most compact in X-rays and largest in the radio.
This can be understood by following the history of energetic electrons produced by the neutron star.
Review these images of the
Crab at four wavelengths. The images have been resized to place them roughly at the same scale.
Procedure
| What to turn in: all of your sketches and the answers to the questions either on the same sheets as your sketches or on separate sheets. Please remember to put your name on all of your work, and to number your answers. |
|---|