
Summary
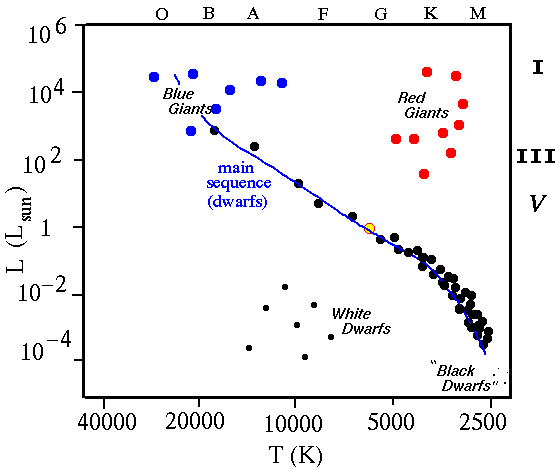
The goals of this lab are to determine the photometric magnitudes and color indices of members of the evolved cluster M67 (NGC2682) using images taken with the V and I filters. A plot of the V magnitudes versus V-I color index constitutes a color-magnitude (H-R) diagram which can be used to determine the distance and the approximate age of the cluster.
Background and Theory
Open star clusters are groups of several hundred stars held together by gravity. All of the stars in a cluster are thought to have been born at the same time from a parent cloud of gas and dust. Many clusters are relatively young (less than ~108 years, young for stars!). A plot of apparent magnitude versus surface temperature (or, equivalently, color index) reveals a characteristic nearly diagonal line called the Main Sequence. Stars on the main sequence are still burning hydrogen in their cores.
However, several clusters are much older, with a large number of stars which have evolved off the main sequence to the giant and supergiant phase. By constructing a color-magnitude diagram of such clusters, we can look for the turn-off point: the point above which all stars have left the main sequence and have evolved to the giant or supergiant phase. (All stars above the turn-off point are more massive than the stars just leaving at the turn-off, and therefore have evolved faster.) Evolutionary models predict the turn-off point as a function of cluster age, so that the age can be determined by simply measuring the turn-off point on a color-magnitude diagram.
The distance to the cluster can also be measured since the main sequence relation is between absolute magnitude (Mv) and color index. By adjusting an observed color-magnitude plot with a universal H-R diagram, the distance modulus (dm=V-Mv) can be easily found. The distance, d, in parsecs is given by:
d=10(dm+5)/5.
Procedure
- Run Camera. Click on File/Open.
- Load the V filter image of M67. Your TA can tell you the directory location of this image.
- You may need to adjust the histogram to make the image clear. Recall that you do this by clicking on Tools/Histogram, and moving the vertical bars.
- When the image is clear, and you are confident that you can see all of the stars, click on Tools/Photometry to open the photometry window. You will be using differential photometry on this cluster of stars. Differential photometry is done by first making a circle around the star (or asteroid, or other small, bright object), and adding up all of the ADU counts within that circle. The sky background brightness is subtracted from this total, and the resulting ADU counts are set equal to a magnitude. The magnitudes of other stars in the field are determined relative to this reference by comparing ADU counts. Fortunately, programs like Camera remove some of the tedium by doing the arithmetic for you.
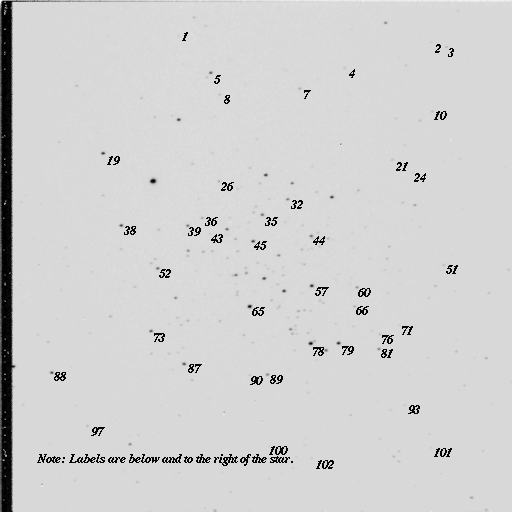
- Use the finding chart ot locate star number 88 in the image. Click on star 88 with the right mouse button, and enter the magnitude of this star in the Base Mag. box. Make sure that you enter the V magnitude in this V-filter image! Click on the Set to Reference bar. You have now set the reference star.
- Starting with star number 1 at the top of the table in the Worksheet, find each star, and click on it with the right mouse button. Record the magnitude for each star in the table.
- Repeat steps 2 through 5 for the I filter image. Don't forget to set the magnitude of the reference star (88) first!
- Fill in the third column of the table (the V-I column).
- Use the included piece of graph paper to plot the V magnitude against the color index (V-I). There should be a clear correlation between the magnitude V and the temperature (proportional to the color index). This correlation was discovered in the early years of this century by the American astronomer H. N. Russell, and independently by the Danish astronomer Ejnar Hertzsprung. The resulting plot is called the Hertzsprung-Russell (H-R) diagram.
- The main sequence and several evolutionary tracks are plotted on a transparency which fits over your color-magnitude plot. Overlay the transparency, and adjust for best fit of the diagonal line to the Main Sequence. Make sure that you only move the transparency in the vertical direction, so that the y-axes overlap.
- The transparency's HR diagram has a vertical axis in absolute visual magnitude (Mv), while your diagram is in apparent visual magnitude. By measuring the difference, the distance to the cluster can be found, as described in the Background and Theory section. Find the distance to M67 in parsecs.
- The transparency shows a series of isochrones (evolutionary tracks of stars with different ages), based on models of stellar evolution. Compare the model tracks with the measurements to estimate the age of the stars in M67.
- The relationship between V-I color index and surface temperature is approximately:
Tsurf=9385 K/((V-I)+0.95).
Find the temperature of the hottest and coolest stars you have measured. How do the temperatures of the hottest and coolest stars compare with the temperature of the Sun?
| Star Number |
V |
I |
V-I |
Star Number |
V |
I |
V-I |
| 1 |
|
|
|
2 |
|
|
|
| 3 |
|
|
|
4 |
|
|
|
| 5 |
|
|
|
7 |
|
|
|
| 8 |
|
|
|
10 |
|
|
|
| 19 |
|
|
|
21 |
|
|
|
| 24 |
|
|
|
26 |
|
|
|
| 32 |
|
|
|
35 |
|
|
|
| 36 |
|
|
|
38 |
|
|
|
| 39 |
|
|
|
43 |
|
|
|
| 44 |
|
|
|
45 |
|
|
|
| 51 |
|
|
|
52 |
|
|
|
| 57 |
|
|
|
60 |
|
|
|
| 65 |
|
|
|
66 |
|
|
|
| 71 |
|
|
|
73 |
|
|
|
| 76 |
|
|
|
78 |
|
|
|
| 79 |
|
|
|
81 |
|
|
|
| 87 |
|
|
|
88 |
10.67 |
10.53 |
0.14 |
| 89 |
11.32 |
11.19 |
0.13 |
90 |
|
|
|
| 93 |
|
|
|
97 |
|
|
|
| 100 |
|
|
|
101 |
|
|
|
| 102 |
|
|
|

© 2003 Weber State University
Revised: 24 April, 2003


