The H-R Diagram
Procedure
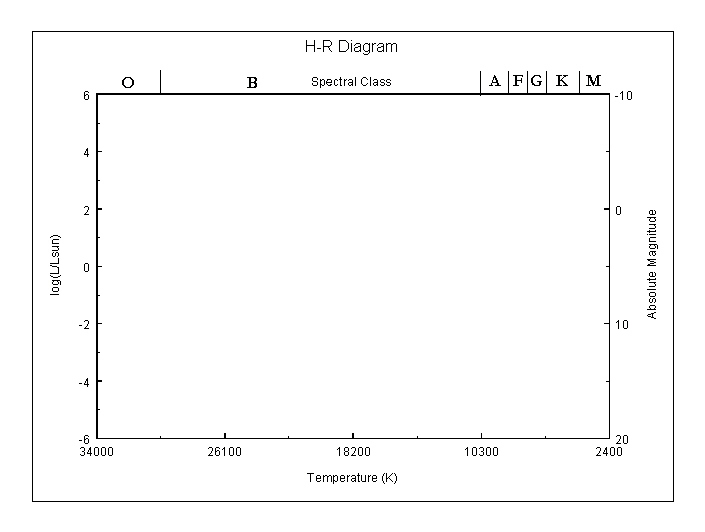
Plot log(L/LSun) versus Temperature for both the lists of nearest stars and brightest stars on the attached graph. Use contrasting colors or symbols so that the two samples of stars are clearly distinguished. The plot you have made will be an HR diagram. Label the region of the diagram where the main-sequence stars, Red Giant stars and White Dwarf stars are found.
	RVega/RSun  =

	RHadar/RSun  =

	RRoss 614-A/RSun  =
Note: some star systems have more than one star in them; count each star in the system individually. For example the 40 Erid system is made of three stars, each of different temperature.
Which list (the bright star list or the near star list)would best be a representative of the total population of the Galaxy? Explain why!
| Star | Apparent Magnitude (m) |
Spectral Class |
Absolute Magnitude (M) |
m - M | Distance |
|---|---|---|---|---|---|
| Sirius | -1.4 | A1 | |||
| Spica | 1.0 | B1 | |||
| Barnard's Star | 9.5 | M4 V | |||
| 61 Cygni A | 5.2 | K5 V | |||
| CN Leonis | 3.5 | M6 V | |||
| Tau Cet | 3.5 | G8 |
Use the spectral types and the HR diagram to estimate their absolute magnitudes. The difference between the apparent and absolute magnitudes is called the distance modulus. Calculate the distance modulus (m-M) for these six stars. The distance to a star (in parsecs) is given by: D=10(m-M+5)/5 Calculate the distance to each of these stars. What assumptions are you making as you derive your distance estimate? How accurate do you think your distance estimate is?
| Star | M(V) | log(L/Lsun) | Temp | Type | Star | M(V) | log(L/Lsun) | Temp | Type |
|---|---|---|---|---|---|---|---|---|---|
| Sun | 4.8 | 0.00 | 5840 | G2 | Sirius A | 1.4 | 1.34 | 9620 | A1 |
| Canopus | -3.1 | 3.15 | 7400 | F0 | Arcturus | -0.4 | 2.04 | 4590 | K2 |
| Alpha Centauri A | 4.3 | 0.18 | 5840 | G2 | Vega | 0.5 | 1.72 | 9900 | A0 |
| Capella | -0.6 | 2.15 | 5150 | G8 | Rigel | -7.2 | 4.76 | 12140 | B8 |
| Procyon A | 2.6 | 0.88 | 6580 | F5 | Betelgeuse | -5.7 | 4.16 | 3200 | M2 |
| Achemar | -2.4 | 2.84 | 20500 | B3 | Hadar | -5.3 | 4.00 | 25500 | B1 |
| Altair | 2.2 | 1.00 | 8060 | A7 | Aldebaran | -0.8 | 2.20 | 4130 | K5 |
| Spica | -3.4 | 3.24 | 25500 | B1 | Antares | -5.2 | 3.96 | 3340 | M1 |
| Fomalhaut | 2.0 | 1.11 | 9060 | A3 | Pollux | 1.0 | 1.52 | 4900 | K0 |
| Deneb | -7.2 | 4.76 | 9340 | A2 | Beta Crucis | -4.7 | 3.76 | 28000 | B0 |
| Regulus | -0.8 | 2.20 | 13260 | B7 | Acrux | -4.0 | 3.48 | 28000 | B0 |
| Adhara | -5.2 | 3.96 | 23000 | B2 | Shaula | -3.4 | 3.24 | 25500 | B1 |
| Bellatrix | -4.3 | 3.60 | 23000 | B2 | Castor | 1.2 | 1.42 | 9620 | A1 |
| Gacrux | -0.5 | 2.10 | 3750 | M3 | Beta Centauri | -5.1 | 3.94 | 25500 | B1 |
| Alpha Centauri B | 5.8 | -0.42 | 4730 | K1 | Al Na'ir | -1.1 | 2.34 | 15550 | B5 |
| Miaplacidus | -0.6 | 2.14 | 9300 | A0 | Elnath | -1.6 | 2.54 | 12400 | B7 |
| Alnilam | -6.2 | 4.38 | 26950 | B0 | Mirfak | -4.6 | 3.74 | 7700 | F5 |
| Alnitak | -5.9 | 4.26 | 33600 | O9 | Dubhe | 0.2 | 1.82 | 4900 | K0 |
| Alioth | 0.4 | 1.74 | 9900 | A0 | Peacock | -2.3 | 2.82 | 20500 | B3 |
| Kaus Australis | -0.3 | 2.02 | 11000 | B9 | Theta Scorpii | -5.6 | 4.14 | 7400 | F0 |
| Atria | -0.1 | 1.94 | 4590 | K2 | Alkaid | -1.7 | 2.58 | 20500 | B3 |
| Alpha Crucis B | -3.3 | 3.22 | 20500 | B3 | Avior | -2.1 | 2.74 | 4900 | K0 |
| Delta Canis Majoris | -8.0 | 5.10 | 6100 | F8 | Alhena | 0.0 | 1.90 | 9900 | A0 |
| Menkalinan | 0.6 | 1.66 | 9340 | A2 | Polaris | -4.6 | 3.74 | 6100 | F8 |
| Mirzam | -4.8 | 3.82 | 25500 | B1 | Delta Vulpeculae | 0.6 | 1.66 | 9900 | A0 |
| Star | M(V) | log(L/Lsun) | Temp | Type | Star | M(V) | log(L/Lsun) | Temp | Type |
|---|---|---|---|---|---|---|---|---|---|
| Sun | 4.8 | 0.00 | 5840 | G2 | *Proxima Centauri | 15.5 | -4.29 | 2670 | M5.5 |
| *Alpha Centauri A | 4.3 | 0.18 | 5840 | G2 | *Alpha Centauri B | 5.8 | -0.42 | 4900 | K1 |
| Barnard's Star | 13.2 | -3.39 | 2800 | M4 | Wolf 359 (CN Leo) | 16.7 | -4.76 | 2670 | M6 |
| HD 93735 | 10.5 | -2.30 | 3200 | M2 | *L726-8 ( A) | 15.5 | -4.28 | 2670 | M6 |
| *UV Ceti (B) | 16.0 | -4.48 | 2670 | M6 | *Sirius A | 1.4 | 1.34 | 9620 | A1 |
| *Sirius B | 11.2 | -2.58 | 14800 | DA | Ross 154 | 13.1 | -3.36 | 2800 | M4 |
| Ross 248 | 14.8 | -4.01 | 2670 | M5 | Epsilon Eridani | 6.1 | -0.56 | 4590 | K2 |
| Ross 128 | 13.5 | -3.49 | 2800 | M4 | L 789-6 | 14.5 | -3.90 | 2670 | M6 |
| *GX Andromedae | 10.4 | -2.26 | 3340 | M1 | *GQ Andromedae | 13.4 | -3.45 | 2670 | M4 |
| Epsilon Indi | 7.0 | -0.90 | 4130 | K3 | *61 Cygni A | 7.6 | -1.12 | 4130 | K3 |
| *61 Cygni B | 8.4 | -1.45 | 3870 | K5 | *Struve 2398 A | 11.2 | -2.56 | 3070 | M3 |
| *Struve 2398 B | 11.9 | -2.88 | 2940 | M4 | Tau Ceti | 5.7 | -0.39 | 5150 | G8 |
| *Procyon A | 2.6 | 0.88 | 6600 | F5 | *Procyon B | 13.0 | -3.30 | 9700 | DF |
| Lacaille 9352 | 9.6 | -1.93 | 3340 | M1 | G51-I5 | 17.0 | -4.91 | 2500 | M7 |
| YZ Ceti | 14.1 | -3.75 | 2670 | M5 | BD +051668 | 11.9 | -2.88 | 2800 | M4 |
| Lacaille 8760 | 8.7 | -1.60 | 3340 | K5.5 | Kapteyn's Star | 10.9 | -2.45 | 3480 | M0 |
| *Kruger 60 A | 11.9 | -2.85 | 2940 | M3.5 | *Kruger 60 B | 13.3 | -3.42 | 2670 | M5 |
| BD -124523 | 12.1 | -2.93 | 2940 | M3.5 | Ross 614 A | 13.1 | -3.35 | 2800 | M4 |
| Wolf 424 A | 15.0 | -4.09 | 2670 | M5 | van Maanen's Star | 14.2 | -3.78 | 13000 | DB |
| TZ Arietis | 14.0 | -3.70 | 2800 | M4 | HD 225213 | 10.3 | -2.23 | 3200 | M22 |
| Altair | 2.2 | 1.00 | 8060 | A7 | AD Leonis | 11.0 | -2.50 | 2940 | M3.5 |
| *40 Eridani A | 6.0 | -0.50 | 4900 | K1 | *40 Eridani B | 11.1 | -2.54 | 10000 | DA |
| *40 Eridani C | 12.8 | -3.20 | 2940 | M3.5 | *70 Ophiuchi A | 5.8 | -0.40 | 4950 | K0 |
| *70 Ophiuchi B | 7.5 | -1.12 | 3870 | K5 | EV Lacertae | 11.7 | -2.78 | 2800 | M4 |